Hurricane.com – tracking the Tropics since 1994.
“Run from the water; hide from the wind.” Since 1994 Hurricane.com has been providing hurricane/tropical cyclone related information for the Atlantic and Pacific basins. Our philosophy has been to provide timely, relevant, and useful information in a format that provides the most information in the least bandwidth intensive format. Since 1978 we’ve been tracking storms.
The Atlantic Hurricane season started on June 1.The Pacific Hurricane season started on May 15.


-
There are no tropical cyclones at this time.
by nhcwebmaster@noaa.gov (NHC Webmaster) on June 16, 2025 at 11:41 pm
No tropical cyclones as of Sun, 15 Jun 2025 13:20:09 GMT
-
Atlantic Tropical Weather Outlook
by nhcwebmaster@noaa.gov (NHC Webmaster) on June 15, 2025 at 11:41 am
000ABNT20 KNHC 151141TWOAT Tropical Weather OutlookNWS National Hurricane Center Miami FL800 AM EDT Sun Jun 15 2025For the North Atlantic...Caribbean Sea and the Gulf of America:Tropical cyclone formation is not expected during the next 7 days.$$Forecaster Bucci


-
There are no tropical cyclones at this time.
by nhcwebmaster@noaa.gov (NHC Webmaster) on June 16, 2025 at 11:41 pm
No tropical cyclones as of Sun, 15 Jun 2025 13:20:09 GMT
-
Atlantic Tropical Weather Outlook
by nhcwebmaster@noaa.gov (NHC Webmaster) on June 15, 2025 at 11:41 am
000ABNT20 KNHC 151141TWOAT Tropical Weather OutlookNWS National Hurricane Center Miami FL800 AM EDT Sun Jun 15 2025For the North Atlantic...Caribbean Sea and the Gulf of America:Tropical cyclone formation is not expected during the next 7 days.$$Forecaster Bucci
-
Eastern North Pacific Tropical Weather Outlook
by nhcwebmaster@noaa.gov (NHC Webmaster) on June 15, 2025 at 11:43 am
082 ABPZ20 KNHC 151143TWOEP Tropical Weather OutlookNWS National Hurricane Center Miami FL500 AM PDT Sun Jun 15 2025For the eastern and central North Pacific east of 180 longitude:Active Systems:The National Hurricane Center is issuing advisories on Tropical Storm Dalila, located in the eastern Pacific basin a couple of hundred miles west of the coast of southwestern Mexico.Offshore of Central America and Southeastern Mexico (EP94):A broad area of low pressure continues to produce disorganized showers and thunderstorms along the coasts of El Salvador, Honduras, Nicaragua, Guatemala, Costa Rica and adjacent offshore waters. Environmental conditions appear conducive for gradual development of this system, and a tropical depression could form by the middle of this week while moving westward to west-northwestward just offshore of the coasts of El Salvador, Guatemala, and southeastern Mexico.* Formation chance through 48 hours...low...30 percent.* Formation chance through 7 days...medium...60 percent.$$Forecaster Bucci
-
Tropical Storm Dalila Graphics
by nhcwebmaster@noaa.gov (NHC Webmaster) on June 15, 2025 at 11:41 am
5-Day Uncertainty Track last updated Sun, 15 Jun 2025 11:41:44 GMT Wind Speed Probabilities last updated Sun, 15 Jun 2025 09:22:11 GMT


Caribbean, Puerto Rico, Gulf, Florida, Eastern US hurricane radar and satellite views


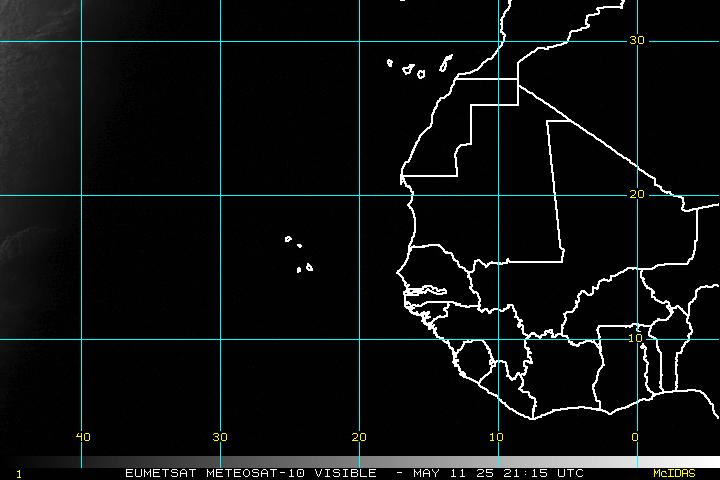
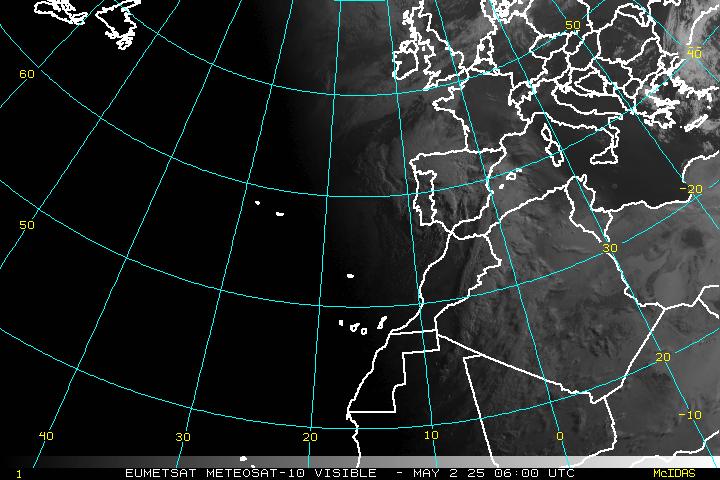
Eastern Atlantic hurricane radar and satellite views


US radar, satellite views and forecasts


US satellite views


Hawaii / Pacific hurricane radar and satellite views


Full Disk hurricane radar and satellite views


Hurricane Maps and Hurricane Projections


Some more interesting views

Have some more? Let us know in the comments below.
=======
Information:
Eastern Pacific Tropical Cyclones:
Recent Comments